
EXREG API & INTEGRATIONS

EXREG API.
Your data, your dashboards.

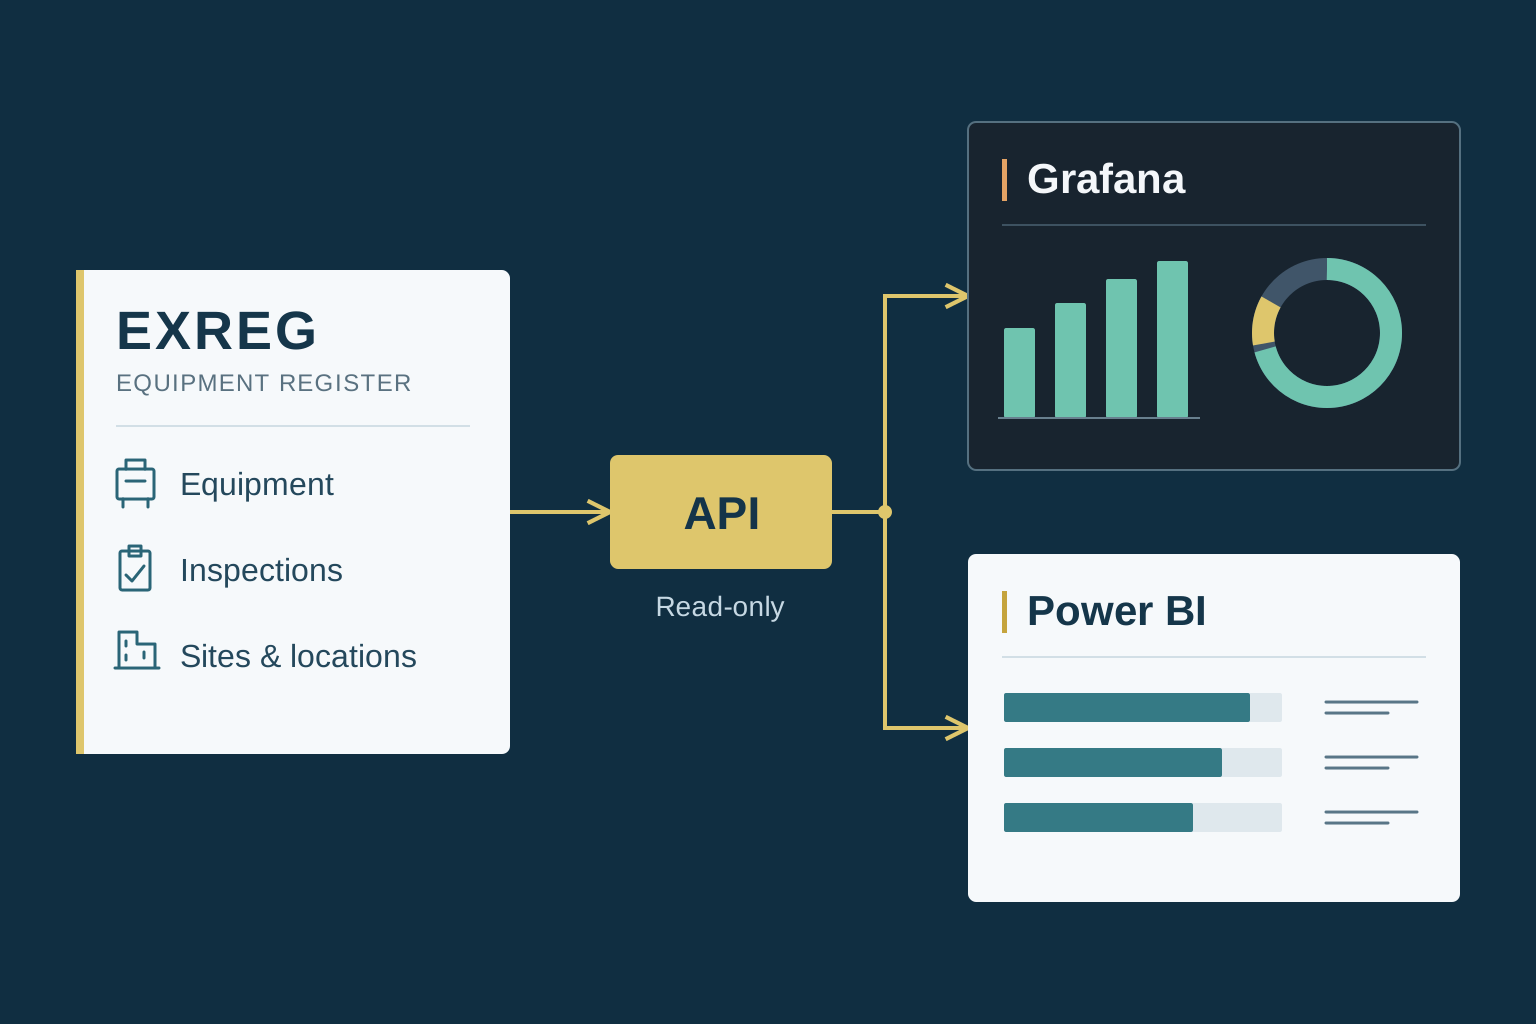
Bring read-only EX register statistics into Grafana, Power BI and your corporate dashboards. See inspection coverage, failed equipment and overdue inspections across your sites.

  • Read-only access
  • Per-register reporting
Diagram showing EXREG equipment and inspection statistics flowing through a read-only API to Grafana and Power BI dashboards
From register to reporting. Read-only API
  1. 01

    EXREG registers

    Equipment, inspection and location statistics from the sites you operate.

  2. 02

    Read-only API

    Reporting access enabled per register, with dedicated API keys.

  3. 03

    Your reporting tools

    Grafana, Power BI, internal portals and your corporate data environment.

YOUR DATA, YOUR VIEW

From site detail
to the bigger picture.

Build dashboards around the people who use them: operational teams, integrity and HSSE teams, and management.

OPERATIONAL REPORTING

Grafana.
Focus on what needs attention.

Bring site KPIs together in an operational dashboard. Use inspection coverage, failed-item counts and area breakdowns to help teams prioritise their next review.

  • Compare inspection coverage across registers
  • Highlight overdue inspections and failed items
  • Explore counts by site, area and status

A possible reporting layout for your team to build.

Grafana · Operational dashboard exampleEXREG

Illustrative dashboard · sample dataOpen full-size image

MANAGEMENT REPORTING

Power BI.
Put the portfolio in perspective.

Bring EX register statistics into management reports alongside your wider operational data. Give leaders a consistent view of inspection coverage and outstanding work across sites.

  • Create a shared view of site performance
  • Include inspection KPIs in monthly reporting
  • Compare locations and inspection types

A possible reporting layout for your team to build.

Power BI · Management dashboard exampleEXREG

Illustrative dashboard · sample dataOpen full-size image

STATISTICS THAT MATTER

The detail behind
every reporting view.

Start with the EX inspection measures your teams already use, then organise them around your reporting needs.

Equipment & coverage

Total assets and inspected-versus-total counts for each register.

Inspection results

Pass and fail distribution, failed items and open failures.

Due & missing inspections

Upcoming, overdue and missing inspections that need attention.

Inspection types

Breakdowns of detailed, close and visual inspections.

Sites & locations

Equipment counts and inspection statistics by site, area and location.

Hazardous-area zones

Zone inspection counts to support your hazardous-area reporting.

GET CONNECTED

A clear route
from register to reporting.

Tell us which registers you want to include and what your reporting team needs to see.

  1. 01

    Define your reporting scope

    Share the sites, registers, audience and KPIs you want to bring together.

  2. 02

    Enable API access

    We enable a read-only reporting scope and provide dedicated API keys for the agreed registers.

  3. 03

    Validate and build

    We help you validate the endpoints. Your team can then build its dashboards, with a recommended KPI layout available from us.

SECURITY & GOVERNANCE

Reporting access,
with a defined scope.

  • Dedicated keys per customer or site
  • Read-only, least-privilege reporting scopes
  • HTTPS encryption in transit
  • Optional logging of API activity
  • Rate limiting available on request

API ACCESS

Your questions.
Answered.

A reporting connection shaped around your sites and the tools your organisation uses.

Talk to our team →
Is the EXREG API read-only?

Yes. Reporting API access is designed for dashboards and KPI reporting. Write access is not required for centralised monitoring.

Can we aggregate multiple sites into one dashboard?

Yes. We can enable access across the registers your organisation operates and provide the API keys needed to combine site KPIs in your reporting tools.

How is access secured?

Access uses dedicated API keys with least-privilege scopes and HTTPS encryption in transit. Rate limiting is available if required.

Do you support Grafana and Power BI?

Yes. EXREG statistics can be used in Grafana dashboards and Power BI reports. We can share a recommended KPI layout to help your team get started.

What kind of KPIs can we pull?

Typical outputs include total assets, inspection coverage, failed items, overdue or missing inspections, inspection types, zone counts and location or area summaries.

How do we request API access?

Contact us with the registers and sites you want enabled. We will provide your reporting keys and help you validate the endpoints.

TAKE CONTROL OF YOUR EX REGISTER

See what EXREG can do for your team.

Request a 7-day trial or speak to us about your inspection workflow.
Trial requests are reviewed before access is provided.

Product detail